
Introduction
Smart meters, solar dashboards, energy monitoring apps, and utility portals have transformed the modern home into a data-rich environment. Yet for many homeowners, this data remains underutilized. Charts are checked occasionally, numbers are observed briefly, and notifications are often ignored. The result is a missed opportunity.
Reading your home energy data correctly is one of the most powerful — and overlooked — skills in residential energy optimization. Understanding consumption patterns allows you to detect inefficiencies, reduce peak demand, optimize automation, and improve long-term financial performance.
Energy data is not just information; it is a diagnostic tool. When interpreted properly, it reveals how your home behaves, when it wastes electricity, and where optimization will generate the greatest return.
This guide explains how to analyze home energy data professionally, what metrics matter most, how to interpret patterns, and how to turn raw numbers into strategic decisions.
Understanding the Core Metrics
Before analyzing patterns, it is essential to understand what the numbers represent.
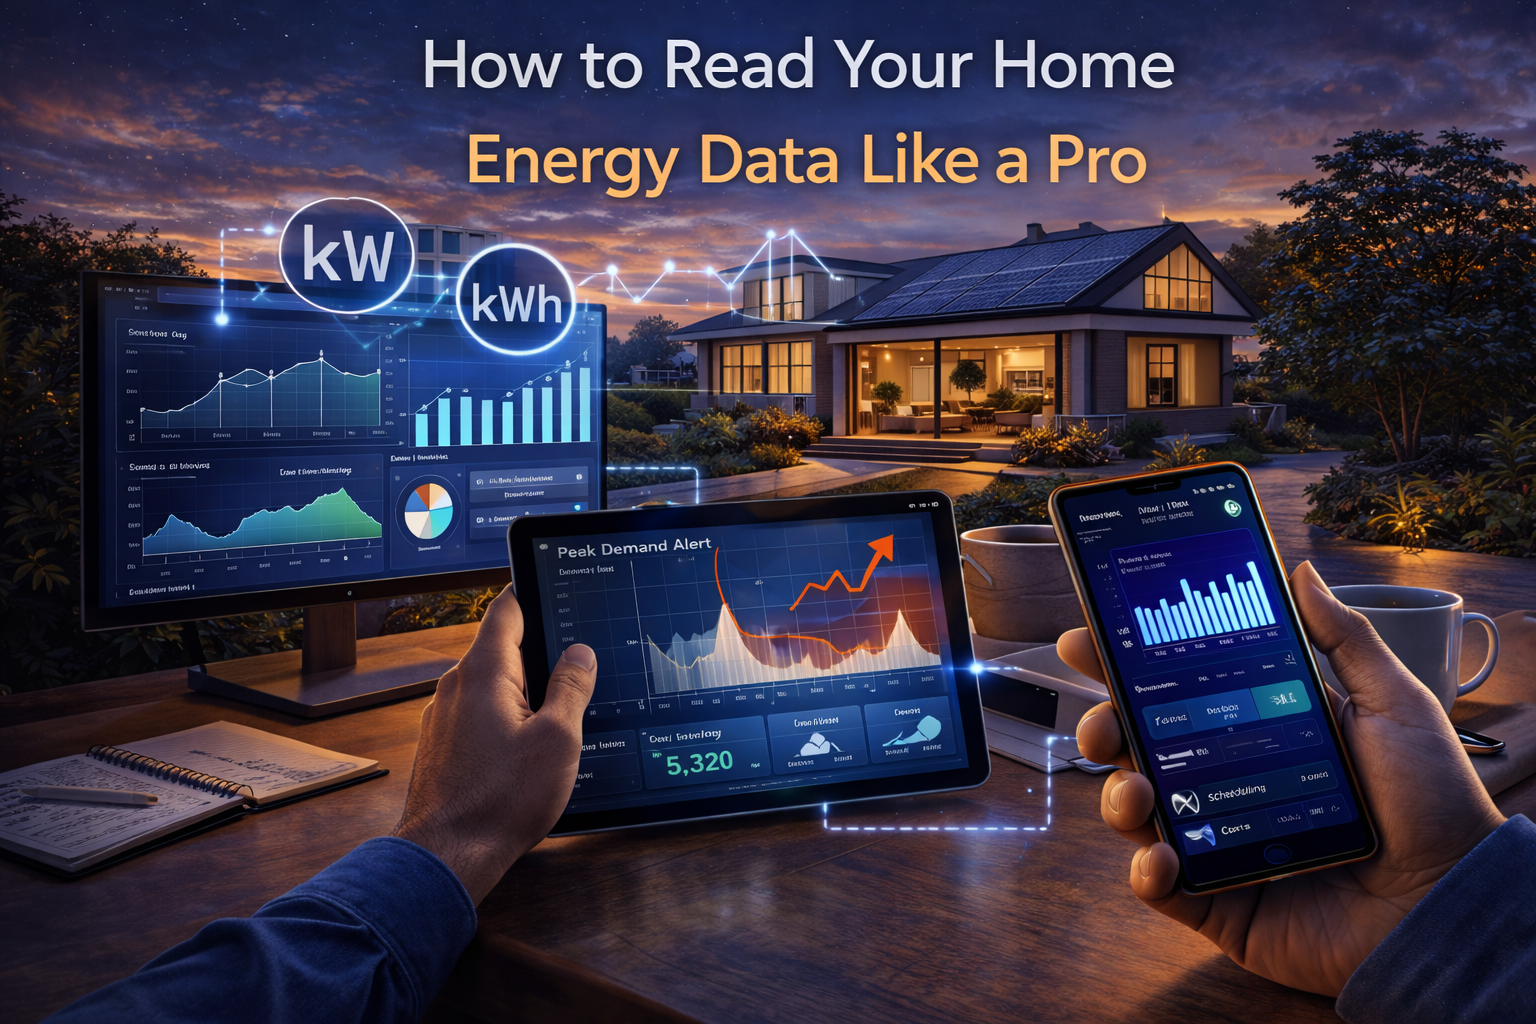
Kilowatt (kW) vs Kilowatt-hour (kWh)
One of the most common sources of confusion is the difference between power and energy.
Kilowatts (kW) measure instantaneous power demand. It reflects how much electricity your home is using at a specific moment.
Kilowatt-hours (kWh) measure total energy consumed over time. This is what utilities charge for.
For example, if your air conditioner draws 3 kW and runs for two hours, it consumes 6 kWh.
Understanding this distinction is foundational. High kW spikes affect peak demand and grid strain. High cumulative kWh affects total monthly cost.
Base Load Consumption
Base load refers to the minimum level of electricity your home uses continuously, even when no major appliances are active.
Common contributors include:
- Refrigerators
- Routers and networking equipment
- Standby electronics
- Security systems
If your base load seems unusually high, it often indicates phantom loads or inefficient appliances.
Monitoring your nighttime minimum usage provides valuable insight into baseline demand.
Identifying Daily Usage Patterns
Energy data becomes most powerful when viewed across daily cycles.
Morning and Evening Peaks
Most households experience two primary demand peaks:
- Morning peak when residents wake up
- Evening peak when people return home
By examining hourly charts, you can determine:
- Which appliances activate during peaks
- Whether HVAC runs excessively
- If lighting demand is higher than expected
Reducing peak intensity lowers grid stress and, in time-of-use regions, reduces costs.
Unusual Spikes
Sudden spikes in kW may indicate:
- Simultaneous operation of large appliances
- Faulty equipment
- EV charging overlap
- HVAC short cycling
Repeated abnormal spikes suggest inefficiency or improper automation scheduling.
Professionals look for patterns, not isolated anomalies.
Monthly and Seasonal Comparisons
Energy analysis should extend beyond daily patterns.
Comparing Month-to-Month Data
Monthly comparisons reveal:
- Seasonal HVAC impact
- Behavioral changes
- Appliance upgrades
- Efficiency improvements
For example, a sudden winter consumption increase may signal insulation issues rather than temperature variation alone.
Year-Over-Year Analysis
Comparing the same month across different years eliminates seasonal bias and reveals long-term performance trends.
A gradual increase may indicate equipment degradation, while a decrease may reflect successful optimization strategies.
Professionals always analyze energy data in context.
Interpreting Solar Production and Self-Consumption
If your home includes solar panels, energy analysis becomes more nuanced.
Key metrics include:
- Total solar production
- Self-consumption rate
- Grid import vs export
- Battery charge cycles
High export combined with high evening grid import indicates poor load alignment.
The goal is not merely generating electricity, but synchronizing consumption with production.
Even without solar, understanding grid import timing helps optimize usage under dynamic pricing structures.
Detecting Phantom Loads and Hidden Waste
Energy monitors often reveal surprising baseline consumption.
If your home uses 400–600 watts continuously overnight, investigate possible phantom loads.
Common culprits include:
- Multiple entertainment systems
- Office equipment
- Garage appliances
- Older refrigerators
Turning off suspected devices temporarily and observing the drop in real-time monitoring confirms the source.
Reducing base load is one of the most straightforward ways to lower monthly consumption.
Analyzing HVAC Efficiency Through Data
HVAC systems leave clear fingerprints in energy charts.
Indicators of inefficiency include:
- Long runtime without achieving temperature stability
- Frequent on-off cycling
- Excessive operation during mild weather
Smart thermostats and energy dashboards allow correlation between outdoor temperature and consumption.
If HVAC usage appears disproportionate to climate conditions, maintenance or insulation improvements may be necessary.
Energy data often identifies HVAC inefficiency before comfort complaints arise.
Using Data to Optimize Time-of-Use Pricing
In regions with time-of-use tariffs, electricity costs fluctuate throughout the day.
Reading hourly data helps identify:
- When high-cost consumption occurs
- Which appliances operate during peak hours
- Opportunities for load shifting
Scheduling laundry, dishwashing, or EV charging during off-peak windows can significantly reduce monthly costs without reducing total consumption.
This is where data literacy becomes financially powerful.
Behavioral Optimization Through Feedback
One overlooked aspect of energy data is behavioral reinforcement.
When homeowners actively review consumption:
- Lights are turned off more consistently
- Thermostat adjustments become more intentional
- High-energy habits become visible
Feedback loops drive efficiency.
Data transparency encourages accountability.
Authority Insight: Energy Literacy Is a Competitive Advantage
In modern energy markets, literacy is leverage.
Utilities increasingly adopt dynamic pricing, grid decentralization, and demand-response programs. Homes that understand and manage energy proactively gain financial and operational advantages.
Professionals treat energy dashboards the same way businesses treat financial statements. Patterns, trends, and anomalies guide decisions.
Energy data is not passive information — it is strategic intelligence.
The homeowners who learn to read it effectively transform their properties from energy consumers into optimized systems.
Frequently Asked Questions
How often should I check my energy data?
Weekly review is sufficient for most households, with deeper monthly analysis recommended.
What is a normal base load for a home?
It varies by size and appliances, but unusually high overnight consumption often indicates phantom loads.
Can energy data help detect faulty appliances?
Yes. Sudden unexplained increases or abnormal cycling patterns often indicate malfunction.
Do I need solar panels to benefit from energy monitoring?
No. Monitoring improves efficiency regardless of renewable integration.
Is professional analysis necessary?
For most households, self-analysis is sufficient, though energy audits provide deeper diagnostics when needed.
Final Considerations
Reading your home energy data like a professional is not about memorizing numbers. It is about recognizing patterns, understanding system behavior, and making informed adjustments.
The difference between average homeowners and optimized households lies in awareness.
When energy data is interpreted correctly, it reveals inefficiencies before they escalate, identifies opportunities for automation, and strengthens long-term financial performance.
In a world of rising energy complexity, data literacy is not optional. It is foundational to building an intelligent, efficient, and resilient home.

Daniel Harper is a graduate engineer with a postgraduate specialization in Intelligent Solutions and Industry 4.0 technologies. He leads the Mogarzi Team, focusing on smart home automation, residential energy efficiency, and intelligent energy management systems. His work combines engineering principles with practical home optimization strategies, translating complex technical concepts into actionable insights for homeowners seeking smarter and more efficient living environments.